
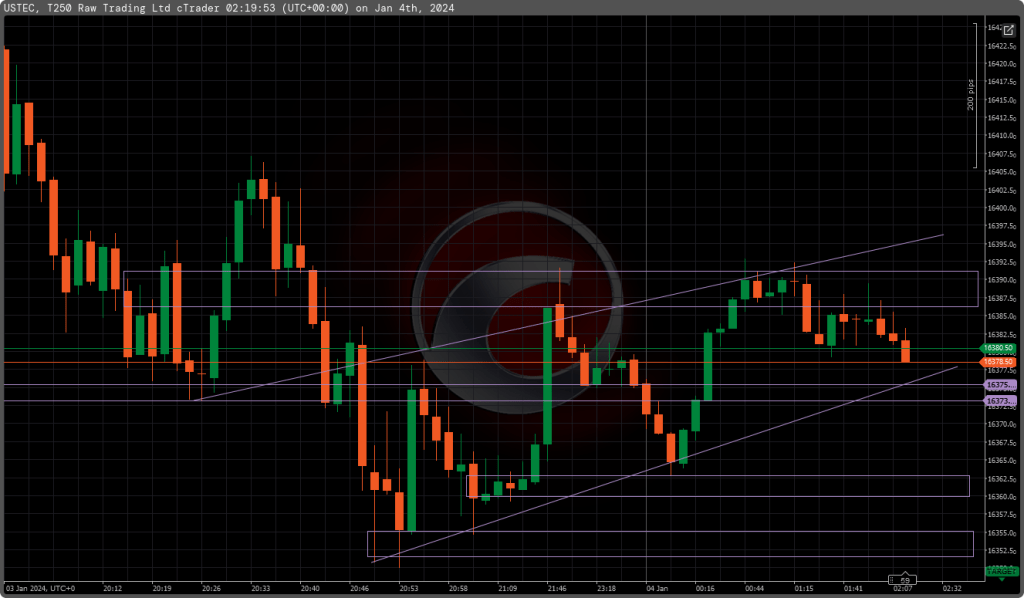
- Date of Analysis: January 4th, 2024
- Charting Software: cTrader
- Time Frame: 250 Tick Chart
Technical Indicators and Patterns:
- Support and Resistance Levels: The chart shows clear support and resistance levels. Support is observed around the 16350 price point, with resistance near the 16420 level.
- Trend Lines: Two converging trend lines suggest the formation of a symmetrical triangle pattern, indicating a period of consolidation with potential breakout or breakdown.
- Candlestick Analysis: A mix of green (bullish) and orange (bearish) candles indicates volatility and a tug-of-war between buyers and sellers.
Market Sentiment:
- The formation of a symmetrical triangle typically suggests that the market is in a state of indecision. A breakout above the resistance or below the support could determine the next significant move.
Key Observations:
- Price Consolidation: The narrowing of the price range within the symmetrical triangle suggests that a significant price move may be imminent.
- Breakout Watch: Traders should monitor for a breakout above the upper trend line or a breakdown below the lower trend line for potential trading opportunities.
- Risk Management: Due to the inherent volatility and uncertainty, traders should use appropriate risk management strategies, including stop-loss orders and position sizing.
The USTEC tick chart indicates a period of consolidation with potential for a significant price move in the near term. Traders should remain vigilant and watch for a breakout or breakdown from the current pattern to capitalize on the subsequent momentum.


Leave a comment