
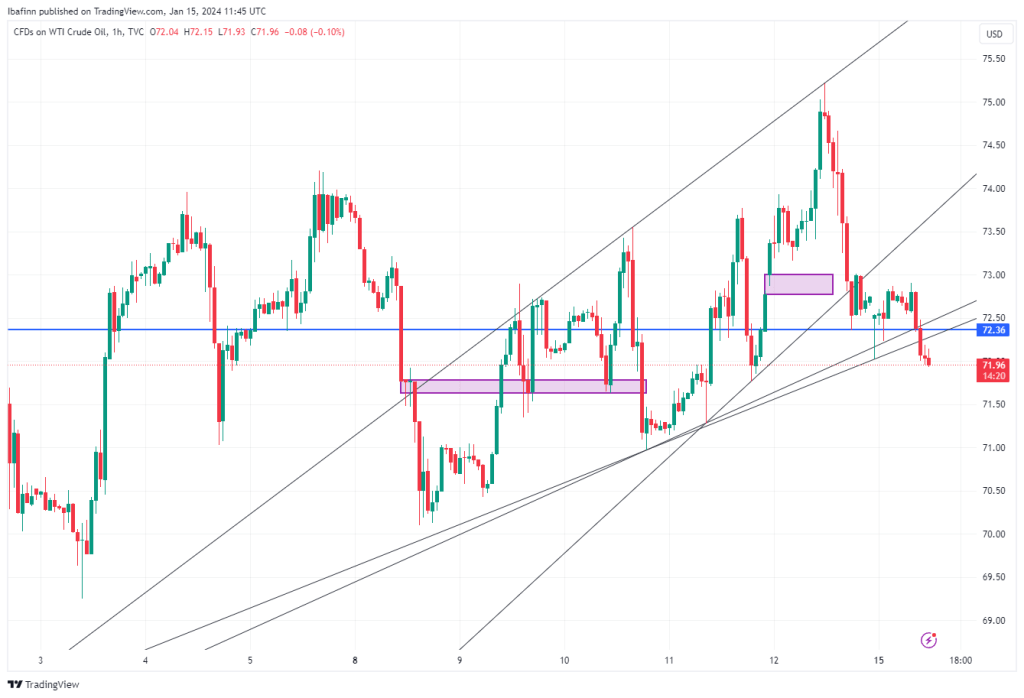
WTI Crude Oil shows signs of a potential slip from the prevailing uptrend as indicated by the recent price action breaching the lower trendline support. This suggests that the market may be transitioning from a bullish bias to a more neutral or potentially bearish stance in the short term.
- The price has been trading within a rising wedge pattern over the past several sessions, indicating a consolidation phase with decreasing volatility.
- A support level at approximately $71.50 has been tested multiple times, indicating its significance. Similarly, resistance at around $73.00 has capped upward movements.
- The breakout from the consolidation zone marked by the purple box was to the downside, suggesting a bearish shift in market sentiment.
- The recent hourly candles have closed below the lower trendline, signaling a potential change in the short-term trend from bullish to bearish.
- The closing price as of the last candle on the chart is at $72.36, which is below the key psychological level of $73.00.
- No significant price recovery is observed after the breakout, which may indicate a lack of immediate buying pressure.
Short-Term Bias: Bearish, due to the breach of the trendline support.
Immediate Support: The next key support is seen at the $71.50 level, where the price could potentially find a floor and buyers might emerge.
Immediate Resistance: The $73.00 level is the immediate resistance, which may now act as a barrier for any bullish retracements.
Actionable Insight: Traders might consider short positions on rallies towards resistance levels or on a break below $71.50, with tight stop-losses above the most recent high or the breached trendline.
For Bears: Look for confirmed breaks below support levels for potential short entries, with the understanding that a move back inside the trendlines could invalidate the bearish outlook.
For Bulls: Await clear signals of price stabilization above $71.50 or a reclaiming of the trendline as support before considering long positions.
The WTI Crude Oil hourly chart suggests a bearish tilt in the market with potential for further downside if the support levels fail to hold. Traders should monitor price action closely and adjust their strategies accordingly, taking into consideration the increased potential for volatility around key technical levels.


Leave a comment