
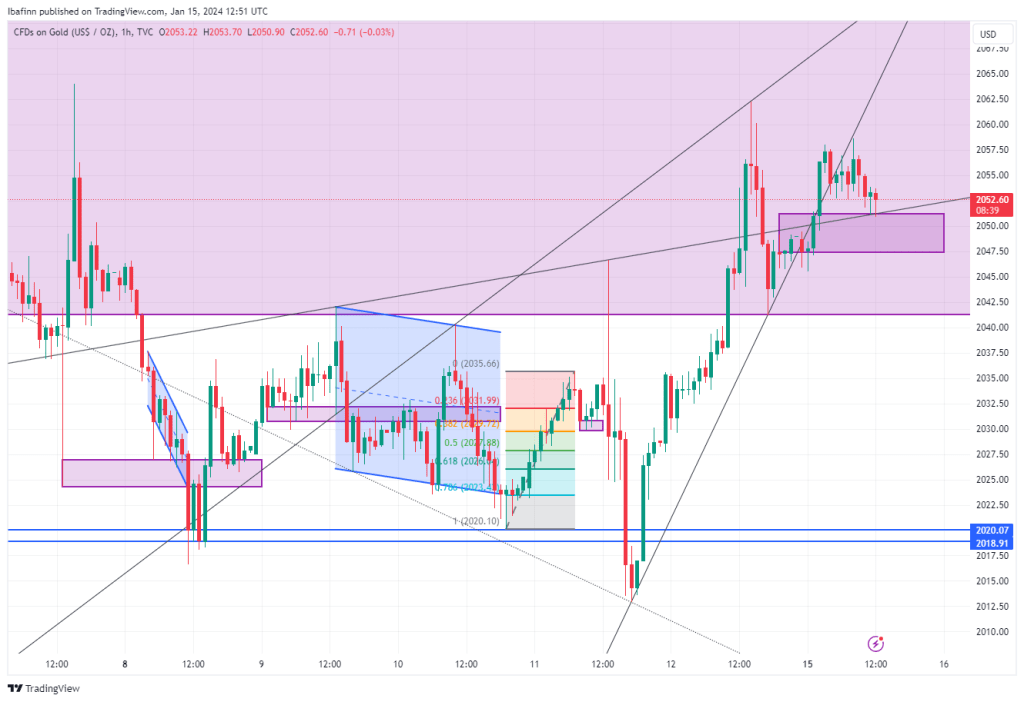
As of the last data point on the chart, Gold is trading at approximately $2052.60.
The price action from January 8 to January 16 shows a period of consolidation followed by an upward trend.
An ascending channel pattern can be observed, with the price making higher highs and higher lows within the channel. This is typically considered a bullish indicator.
The price is currently testing the lower boundary of the ascending channel, which could act as support.
There is a highlighted rectangle (possible support zone) around the $2047.50 to $2050.00 price range, suggesting a region where the price may potentially bounce back if it retraces to these levels.
Volatility appears to be moderate, with some spikes in price movements, as evidenced by the longer wicks on several candles.
Immediate resistance can be anticipated around the $2060.00 mark, which corresponds to recent highs.
Strong support is identified at around $2040.00, marked by the lower blue line, which has historically acted as a strong bounce point.
- The chart suggests cautious optimism for bulls, with the current price still within the upper region of the ascending channel.
- Traders might consider looking for buy signals upon successful tests of support, particularly within the designated support zone.
- Stop losses could be considered below the support level to manage risk, especially if the price breaks the ascending channel pattern.
As of the latest data, Gold CFDs exhibit bullish characteristics, but caution is warranted given the recent consolidation and test of the channel’s lower boundary. Traders should monitor for either a confirmed bounce within the channel or a break below, which could signal a trend reversal.


Leave a comment