
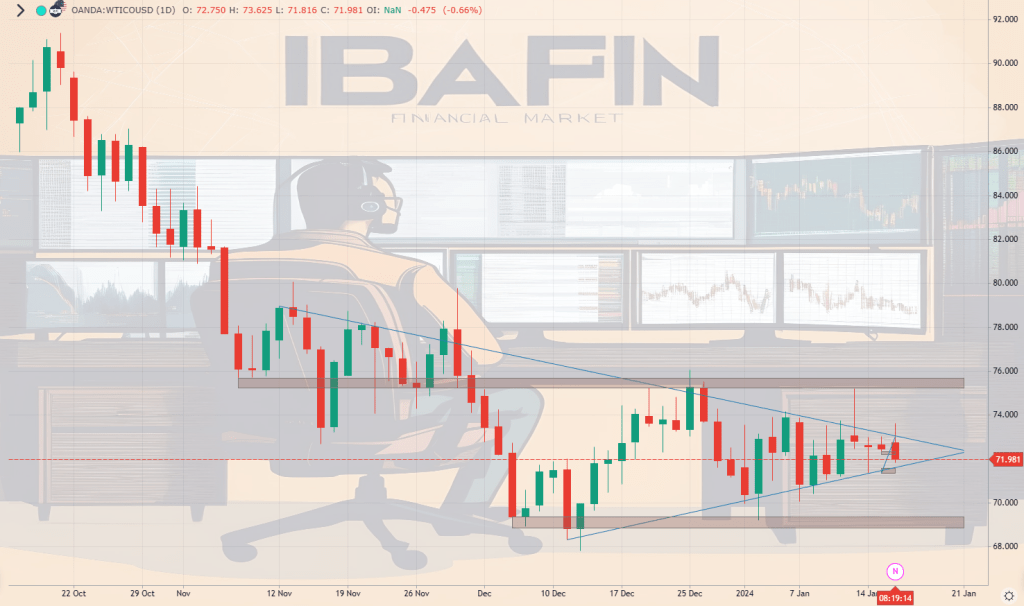
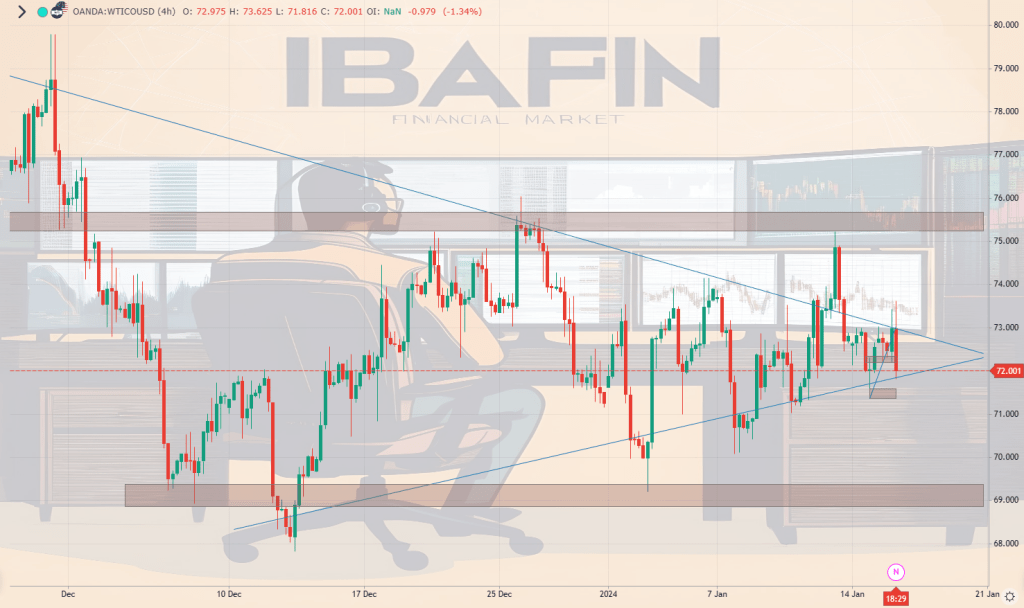
Considering the consolidation pattern observed across multiple timeframes, the market sentiment appears to be in a state of equilibrium. A breakout from the daily chart’s symmetrical triangle pattern could determine the direction for the medium-term trend.
- Bullish Scenario: A decisive close above the triangle’s resistance could confirm a bullish outlook, potentially leading to an increase in buy-side volume.
- Bearish Scenario: Conversely, a break below the support level might suggest that a continuation of the bearish trend is likely, and caution is advised for buy-side positions.
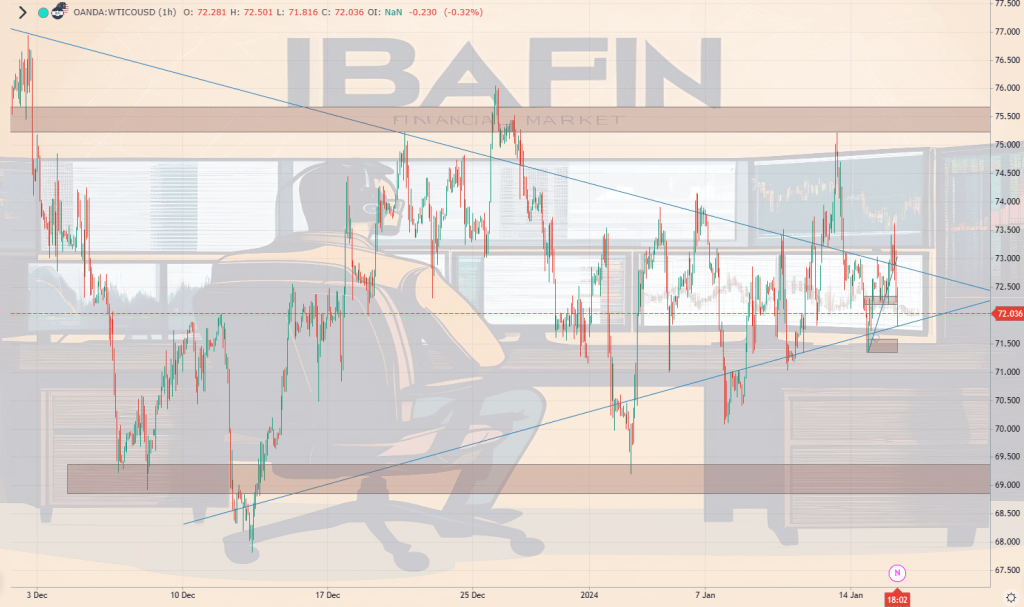
The current technical structure suggests that crude oil prices are at a critical juncture. Traders should watch for a breakout from the consolidation pattern for confirmation of the market’s next move. It is recommended to wait for clear signals before entering positions, as the compressed price action within the triangle suggests a substantial move could follow. Risk management strategies should be employed to protect against the volatility that may result from the breakout.
- Monitoring Breakouts: Closely monitor the price as it approaches the apex of the triangle on the daily chart for a breakout.
- Volume Confirmation: Look for an accompanying surge in volume as a confirmation of breakout direction.
- Set Clear Targets: If entering a position after a breakout, set clear profit targets and stop-loss orders based on established support and resistance levels.
Traders should remain vigilant and responsive to the market’s indication of direction, as the consolidation pattern’s resolution could offer significant trading opportunities.


Leave a comment