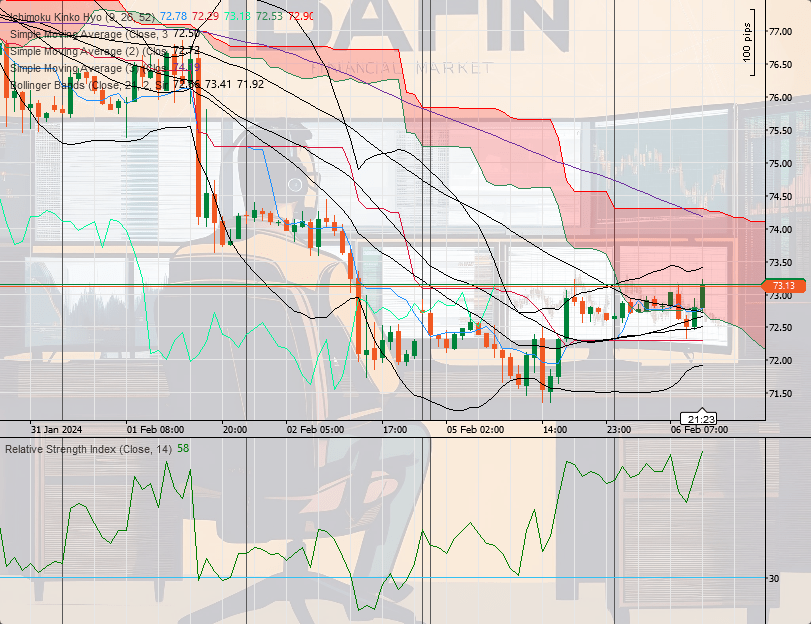
The chart shows the Ichimoku Kinko Hyo indicator, which provides information on the trend and momentum of the price. The price appears to fluctuate within the clouds, indicating a period of uncertainty or consolidation without a clear trend.
There are several simple moving averages (SMAs) displayed, suggesting a level of dynamic support and resistance. The shorter-term SMAs seem to be converging, which may indicate a lack of strong directional momentum.
The price has interacted with the upper and lower bands of the Bollinger Bands, indicating periods of higher volatility. Currently, the price is within the bands, closer to the middle Bollinger Band, suggesting reduced volatility.
The candlesticks over the past few days have been relatively small with wicks on both sides, which can be indicative of indecision among traders.
The RSI is fluctuating around the mid-level (50), indicating neither overbought nor oversold conditions. It shows a recent dip, suggesting a slight increase in selling pressure or loss of momentum.
- The price started just above $73.00 and experienced significant volatility, with peaks breaching above $74.50 and troughs dipping near $71.50.
- A notable downtrend was evident at the start of the period, followed by a recovery and then a period of sideways movement.
- The market sentiment seems neutral to slightly bearish, given the price action within the Ichimoku Cloud and the RSI nearing the mid-level. The convergence of SMAs and the position within the Bollinger Bands also suggest a lack of a strong trend.
The oil market for the observed period is characterized by a lack of a definitive trend, with price consolidation within a range. Traders may be adopting a wait-and-see approach, leading to the indecisive market sentiment reflected in the technical indicators. Investors should look for a breakout from the Ichimoku Clouds for a clearer trend indication or for more pronounced RSI divergence from the mid-level to signal a momentum change.


Leave a comment