
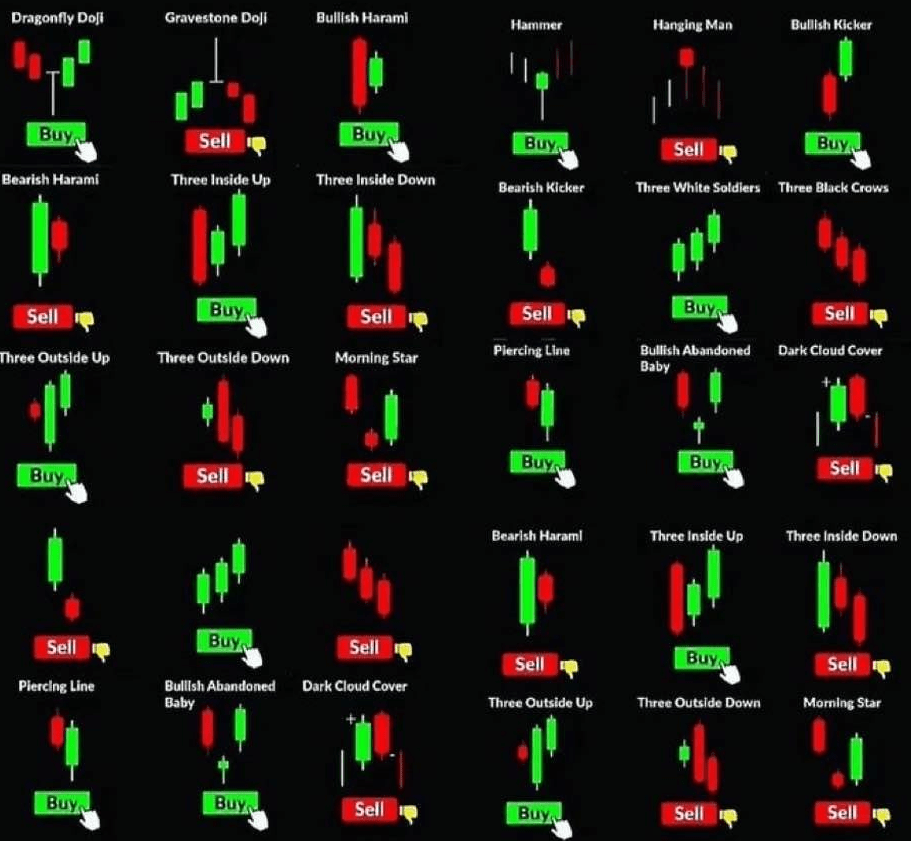
Understanding candlestick patterns is a crucial aspect of technical analysis in trading. Originating from Japan over 300 years ago, these patterns are a popular tool among traders to gauge market sentiments and forecast potential price movements. Each pattern signifies a certain market behaviour and can be used to make informed buy or sell decisions. Here, we break down some of the most significant candlestick formations and what they imply for traders.
Bullish Patterns: Time to Buy
1. Dragonfly Doji: This pattern indicates potential market reversal from bearish to bullish. It has a long lower shadow and no upper shadow, showing that buyers are beginning to outweigh sellers.
2. Bullish Harami: A smaller green candle is fully contained within the range of the previous red candle, suggesting a possible bullish reversal.
3. Three Inside Up: This is a confirmation pattern where two green candles follow a red candle, confirming the shift towards a bullish market.
4. Piercing Line: With the second candle opening lower but closing more than halfway into the body of the previous red candle, this pattern indicates a strong buying pressure and a potential bullish reversal.
5. Bullish Engulfing: A large green candle completely engulfs the smaller red candle preceding it, signaling strong buying pressure.
6. Morning Star: A three-candle pattern with a small-bodied candle between a long red and a long green candle, suggesting the dawn of a bullish era.
7. Three White Soldiers: A trio of long, green candles with small wicks, indicating a strong upward trend.
Bearish Patterns: Time to Sell
1. Gravestone Doji: The inverse of the Dragonfly, this pattern suggests a bearish reversal with sellers overpowering buyers.
2. Bearish Harami: A small red candle fully contained within the previous green candle, indicating potential bearish movement.
3. Three Inside Down: A confirmation pattern with two red candles following a green candle, signaling a bearish turn.
4. Dark Cloud Cover: A bearish reversal pattern where a red candle closes into the previous green candle’s body, showing sellers are taking control.
5. Bearish Engulfing: This pattern shows a large red candle engulfing a smaller green candle, highlighting strong selling pressure.
6. Evening Star: A mirror image of the Morning Star, this three-candle pattern indicates the end of the bullish phase and a shift towards bearishness.
7. Three Black Crows: A series of three long, red candles with short wicks. It’s a strong bearish signal, often indicating the end of a bullish trend.
The Hammer and Hanging Man: Indecision in the Market
The Hammer: A bullish reversal pattern occurring at the bottom of a downtrend with a small body and long lower wick, which indicates that the market is rejecting lower prices.
The Hanging Man: A bearish reversal pattern that resembles the hammer but occurs at the top of an uptrend, suggesting that buyers are losing control to sellers.
In conclusion, candlestick patterns are the language of the market, offering insights into the psychological state of traders. Whether you are a seasoned trader or just starting, understanding these patterns can be a powerful addition to your trading arsenal. However, it is important to use them in conjunction with other technical analysis tools and market fundamentals to make the most informed decisions. Remember, no single indicator is foolproof, and risk management should always be a top priority.


Leave a comment