
As traders, one of the biggest challenges we face is accurately gauging market sentiment. Is the market bullish, bearish, or neutral? Understanding this can greatly influence our trading decisions. That’s why I’ve created a powerful new TradingView script designed to help you track market sentiment using a combination of popular technical indicators: the RSI, MACD, and Simple Moving Averages (SMA).
What Does This Script Do?
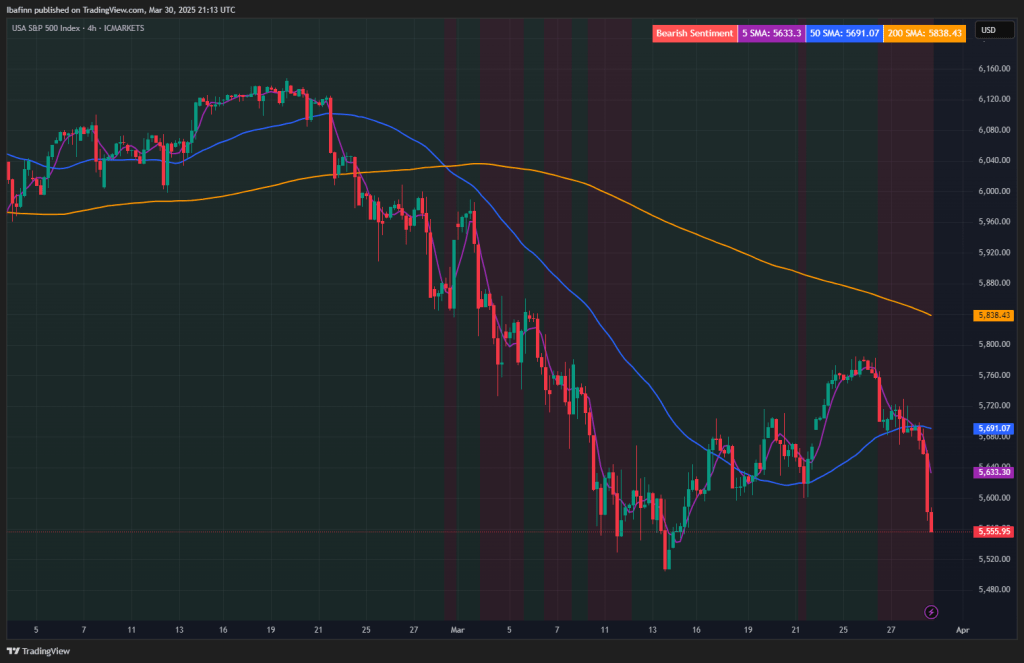
The goal of this script is to provide a real-time market sentiment analysis. By combining several well-known indicators, the script automatically calculates whether the market is in a bullish, bearish, or neutral state based on the following factors:
- RSI (Relative Strength Index): A momentum indicator that measures the speed and change of price movements. The script considers whether the RSI is above or below 50 to assess market strength.
- MACD (Moving Average Convergence Divergence): This trend-following momentum indicator helps to identify the relationship between two moving averages of a security’s price. The script checks whether the MACD line is above or below the signal line.
- SMA (Simple Moving Averages): The script uses three key SMAs — the 5-period, 50-period, and 200-period SMAs — to determine the short-term, medium-term, and long-term trends.
Key Features of the Script
1. Sentiment Background Color
The script highlights the overall market sentiment directly on your chart with dynamic background colors:
- Green for a Bullish Sentiment (when the market is expected to rise)
- Red for a Bearish Sentiment (when the market is expected to fall)
- Gray for Neutral Sentiment (when no clear direction is established)
This allows you to quickly glance at the chart and get an understanding of the market’s mood.
2. SMA Values Displayed in a Table
Instead of cluttering the chart with multiple lines and labels, the script displays the values of the 5-period SMA, 50-period SMA, and 200-period SMA in an organized table at the top-right corner. Each SMA value is color-coded to match the corresponding line color on the chart, so you can easily correlate the data with the chart.
- Purple for the 5-period SMA
- Blue for the 50-period SMA
- Orange for the 200-period SMA
This makes it easy to track the performance of the different SMAs without crowding the chart.
3. Clear Sentiment Labels
The script automatically adds text labels to the chart to indicate the current sentiment:
- “Bullish Sentiment” when the market is in a positive trend
- “Bearish Sentiment” when the market is trending down
- “Neutral” when no clear trend is detected
4. Easy-to-Read Plotting
In addition to the table and sentiment labels, the script also plots the 5-period, 50-period, and 200-period SMAs directly on the chart. This allows you to easily track short-term, medium-term, and long-term trends while having the sentiment information readily available.
How Can You Use This Script?
This script is perfect for traders who rely on sentiment analysis and trend-following strategies. By using the sentiment background, you can instantly understand whether the market is bullish or bearish, and adjust your trading strategy accordingly. The table with SMA values helps you keep track of price action over different timeframes, while the sentiment labels provide clarity and context.
To request access please message in the #reception channel of the discord with your TradingView username


Leave a comment