
For traders diving into the world of SPX options, dashboards like this one offer deep insights—but only if you know what you’re looking at. In this post, we’ll break down how to interpret this data-rich interface and use it to enhance your market analysis and decision-making.
What You’re Looking At
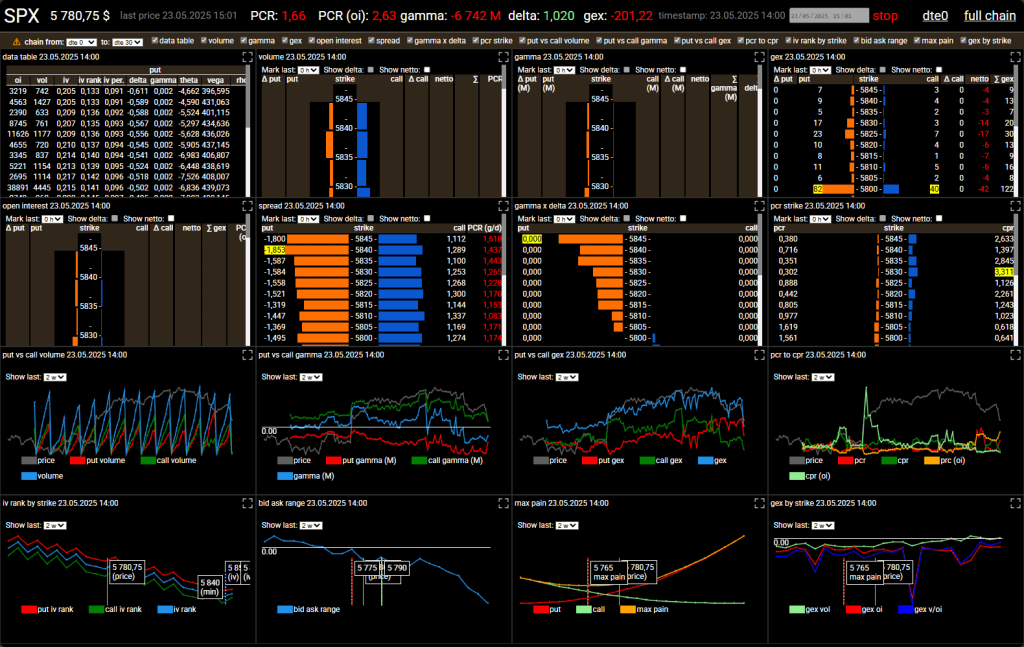
This dashboard visualizes real-time SPX options flow, combining key metrics like volume, open interest, gamma exposure, put-call ratios, implied volatility, and max pain. It’s built for fast-paced insights into market sentiment and positioning.
Let’s explore each section.
Top Bar: Key Market Sentiment Metrics
- SPX Price: Current index price (5,780.75 USD).
- PCR (Put/Call Ratio):
- Volume-based (PCR): 1.66 — more puts than calls traded, indicating bearish sentiment.
- Open interest-based (PCR (oi)): 2.63 — heavily skewed toward puts.
- Gamma: -6,742M — net negative gamma suggests increased volatility.
- Delta: 1,020 — net market delta; higher values indicate more buying pressure.
- GEX (Gamma Exposure): -201.22 — more negative gamma amplifies potential volatility.
Top Row: Key Data Blocks
1. Data Table (Leftmost)
Breakdown of options metrics by strike:
- oi (Open Interest)
- vol (Volume)
- imp vol (Implied Volatility)
- delta, gamma, theta, vega: Greek measures of risk and sensitivity.
- Useful to identify heavily traded and hedged strikes.
2. Volume, Open Interest, Spread
Bar charts show distribution of volume and open interest across strikes. Helps visualize:
- Where the market is focused (clustered strikes).
- Balance between puts and calls.
3. Gamma vs Delta
Reveals gamma impact by strike—essential for understanding dealer hedging activity.
4. GEX
Gamma Exposure per strike. Orange indicates net short gamma; blue indicates net long gamma.
Middle Row: Advanced Ratios and Sensitivities
1. Put vs Call Volume
Line chart showing volume trends over time.
- Compare market sentiment changes.
- Spikes in put volume signal bearish sentiment.
2. Put vs Call Gamma
Line chart displaying gamma exposure for both puts and calls.
- Helps identify risk zones where market makers may need to hedge aggressively.
3. Put vs Call GEX
Similar to gamma but includes the effect of open interest.
4. PCR by Strike
Put/Call ratio for each strike. Higher ratios indicate stronger bearish positioning.
Bottom Row: Market Structure Insights
1. IV Rank by Strike
Shows how expensive options are relative to their historical implied volatility.
- Put IV Rank
- Call IV Rank
- Helps identify overpriced or underpriced options.
2. Bid-Ask Range
Displays the current spread across strikes — useful for gauging liquidity.
3. Max Pain
The price point where most options expire worthless.
- Currently around 5765 — the market may gravitate toward this level near expiration.
4. GEX by Strike
Shows how gamma exposure changes by strike, incorporating both volume and open interest.
How to Use This Dashboard
- Gauge Market Sentiment: High PCRs and negative gamma suggest a defensive or bearish market tone.
- Spot Key Levels: Look for high open interest and gamma clusters for critical support/resistance.
- Track Dealer Hedging: Negative GEX often implies greater potential for large price moves.
- Plan Your Trades:
- Avoid illiquid strikes with wide bid/ask spreads.
- Consider trading near the max pain level for expiration strategies.
- Use IV rank to identify opportunities in volatility.
Pro Tips
- Watch Gamma Flip Points: Strikes where gamma turns negative can accelerate price movements.
- Check GEX and Volume Together: High GEX with high volume suggests significant dealer involvement.
- Don’t Ignore IV Rank: Volatility pricing often hints at anticipated events or market stress.
Reading an SPX options flow dashboard isn’t just for quants or institutional players. With some practice, retail and swing traders can extract powerful insights to improve timing, risk management, and trade selection. Treat each section as a piece of a larger puzzle, and you’ll unlock a more complete understanding of market dynamics.


Leave a comment